During 2020 between June 18 and June 24 Imperva mitigated massive 200K RPS (Request Per Second) attacks on a daily basis.
Here at Imperva we investigate major attacks we mitigated in order to gain a better understanding of their anatomy and allow for smarter mitigation. In this blog post we’ll analyse these massive attacks, and provide key takeaways for improving your website’s security.
Normally, when investigating an application DDoS attack, the immediate center of focus is the RPS. If it’s too high – we’re probably under attack. But RPS is just the tip of the iceberg, and there’s much more to explore.
The first thing we noticed about the attackers was that they were all aiming at sites from the same industry – entertainment, and more specifically, gaming and gambling. Seeing how that’s the most attacked industry, we weren’t surprised. We decided to take a closer look at the origin of these attacks.
From figure 1 It’s easy to see that while normally most of the traffic to the attacked sites comes from China, during the attack the whole distribution changed and traffic started flowing from many additional countries. It isn’t surprising that most of the normal traffic is coming from China, seeing how these sites are Chinese. What is surprising is that attackers didn’t put much effort into making it look like they attacked from the site’s country, i.e. China. If we’ll throw in the fact that China topped 2019 in generating application DDoS attacks, it begs the question – why did they bother proxying the attack through other countries? One possible answer is that the attackers used botnets, or DDoS for hire services, that utilise bots spread over many different countries. Another possibility is that the attackers just weren’t from China.
We looked further into this issue by focusing on each day and DDoS attack independently. Figure 2 shows the number of source countries that sent at least 1% of the traffic. You can see that during a DDoS attack the number of source countries spikes.
Each site has its own unique pattern – source country pattern, traffic patterns, web client pattern and more. It’s tricky to observe these patterns by monitoring a site from the outside, so we didn’t expect the attackers to manage to imitate it. Let’s look into these patterns and compare them to the attack patterns.
Let’s start by analysing the attacking source countries over time during an attack.
So this is actually quite amazing. As we previously saw in figure 2, during DDoS there are way more countries, all distributed quite equally, while during normal times there’s barely any diversity. Figure 3 focuses on the day of the attack and you can easily see that during the attack itself, between 13 and 19, the source country distribution changed significantly. So, if the attackers aren’t bothering to copy the site’s source country pattern, where else are they being sloppy? Let’s dive in.
Large or Small: The Client is The Expert
Here at Imperva we use a sophisticated Client Classification mechanism as part of our bot detection system to know exactly who’s who and which web client is actually behind the request. That being said, in many cases relying solely on the User Agent can be enough. We decided to use this system to look into the web clients that visited the sites during, before, and after the attack.
Figure 4 shows the difference between DDoS and normal traffic. Overall, it’s pretty clear that the attackers used generic bots, while the sites’ normal traffic is composed mainly of, surprise surprise, browsers, applications, and some generic bots.
We decided to run this analysis per site and found some amazing results. We increased the granularity by looking at the specific web clients that visited the site, rather than their general category. Instead of grouping browsers, for example, and displaying them as the same tool, we show each one separately.
You can see in figure 5 that between 13 and 19 there was a serious shift in web client distribution. “Coincidentally”, at the same time, the site was under a DDoS attack. Normally, many different web clients visit the site, but during an attack all this diversity of web clients gets pushed aside by the bots that propagate the DDoS attack.
What if we “trust” the client and identify them using their User Agent, which is an HTTP header that’s completely controlled by the client/attacker, will we still see a difference?
According to figure 6 – The distribution shift is still very noticeable! Note that the attacker did try to imitate what they assumed the site’s traffic would look like – UC, QQ and android browsers. Seeing how UC and QQ are chinese browsers, and how many chinese mobile devices use android, this makes perfect sense. However, as you can see, the site’s real traffic is quite different.
Example of Web Traffic Analysis: Distribution Shift is Key
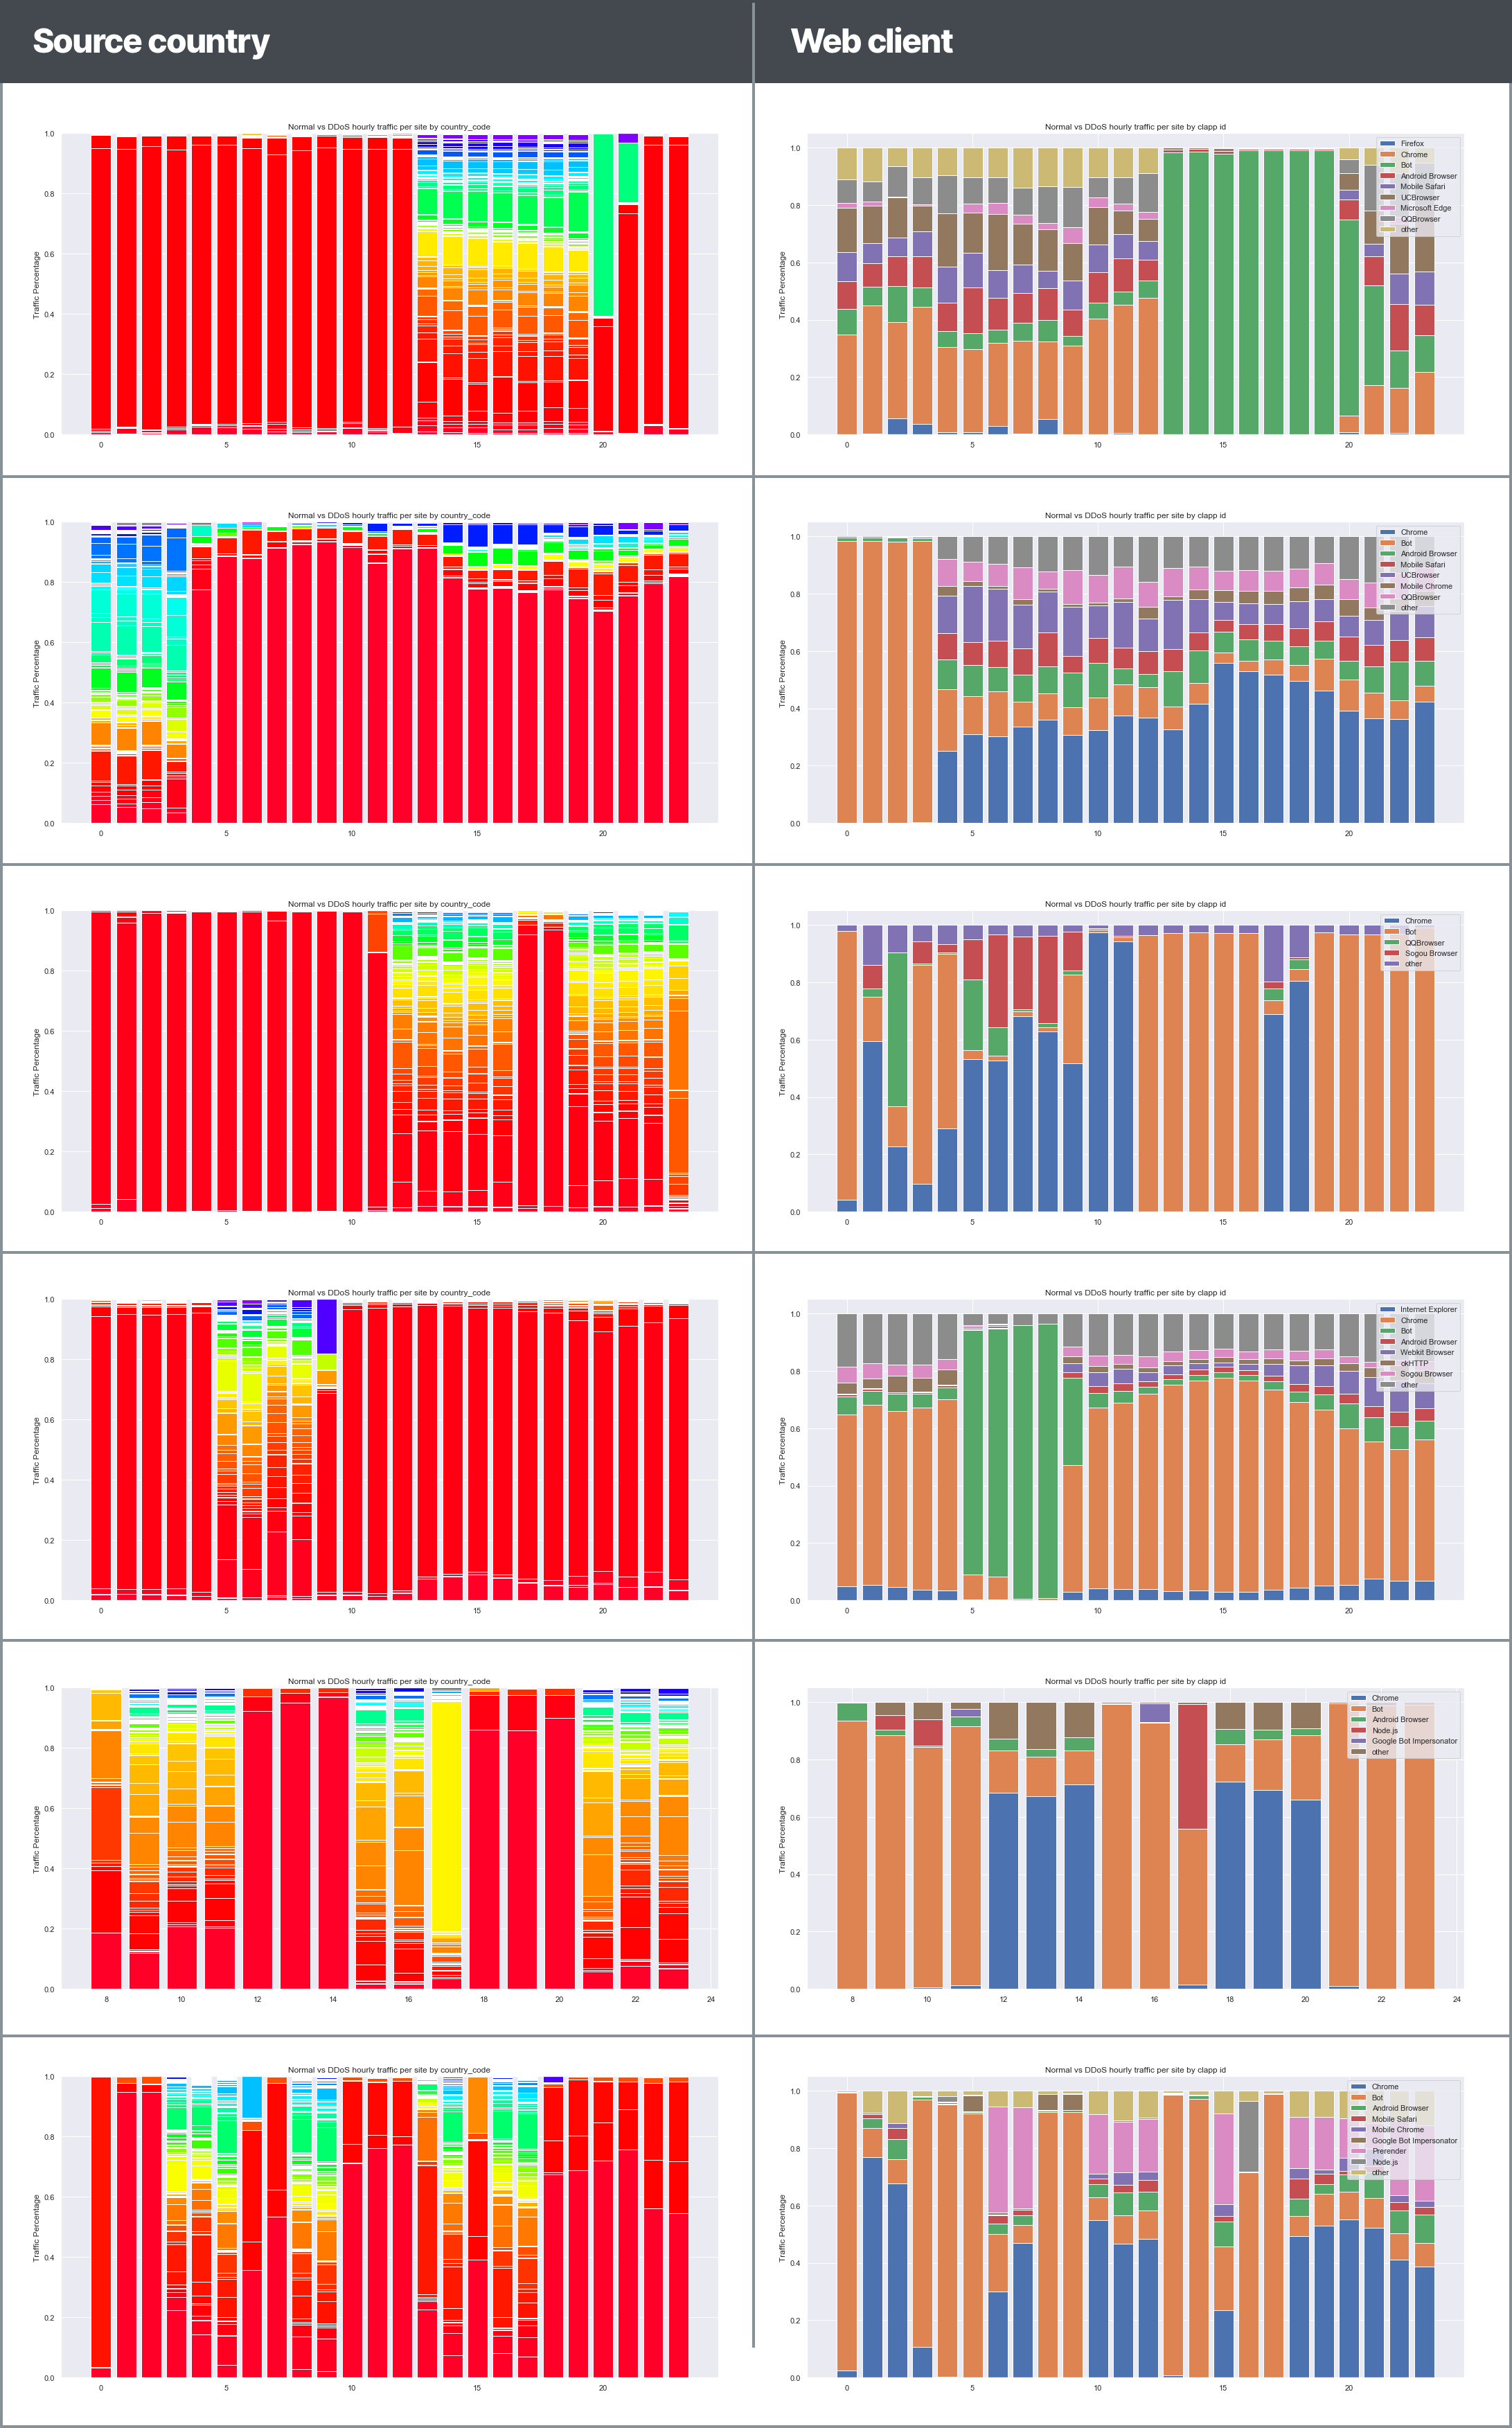
In the following table you can see the daily distribution of web clients and source countries in the massive attacks we observed. Every row represents a different attack (click to enlarge image):
The data speaks for itself – you can easily see how the distribution changes violently during the attack, and how these changes are negatively correlated between the source countries and web clients.
User Agent Spoofing and Additional Parameters
Another factor we looked at was the number of impersonators – web clients that declare themself as something they’re not. In some cases this is a legitimate behavior, for example if you want to get the desktop version of a site from your mobile, you might want to declare yourself as a non-mobile browser. In other cases the behavior isn’t legitimate but it isn’t exactly an attack, for instance, declaring yourself as google-bot can help you evade commercials and paywalls. However, it is also very common for attackers to impersonate legitimate web clients in order to evade detection.
We decided to check the number of impersonators during a DDoS vs peace time:
The statistics in figure 7 are pretty straight forward – there are way more impersonators during DDoS attacks. You might notice that during 19.6 the difference was pretty small. We decided to look into it.
Figure 8: correlating between impersonators and attackers

As you can see – the impersonators (upper plot figure 8) are correlated with the attacks on the website (lower plot figure 8). During the DDoS attack in the first few hours (0-3) there were many attacks, later, starting from 14, it’s easy to see the correlation between the number of attacks and impersonators.
The conclusion is pretty straightforward – a rise in impersonators is an indication of malicious activity, but not necessarily DDoS.
Major DDoS Attack Takeaways
There’s a lot you can do to protect your website without working too hard. The quickest win would be to look at geoIP. Try blocking countries you expect little to zero traffic from whenever the overall RPS gets too high. If you can’t apply this kind of rule easily – try blocking these countries completely. You can do the same for web clients you don’t expect to see any traffic from. So when the RPS goes sky high – try blocking all User Agents you don’t expect to see in your site. However, please note that while these solutions can protect you against sloppy, spray and prey attacks, they can easily be bypassed by a skilled attacker.
If you’re lacking the capabilities to implement such rules, or if these simple rules just don’t suffice – Imperva has the complete DDoS solution to protect your website and network.
Try Imperva for Free
Protect your business for 30 days on Imperva.


