Managing the Imperva SaaS infrastructure is like herding cats. There are so many moving parts, new developments, testing, fixing bugs, patching, reducing our SLAs, fighting the bad guys and, most importantly, pushing our latest and greatest to production every week. And it all runs like clockwork… in our dreams.
But in the real world, there’s sweat and mistakes, trying to do any number of things at once, and never, ever, having enough resources. That’s life in the world of cutting-edge technology – setting up new labs, trying to stay ahead of the hackers, and protecting our customers. We’re runners, sprinting our tasks in record time.
Well, it is up and running, but at some point the comfortable track was replaced by a minefield. Our product is complex (more on that soon), and our release philosophy is demanding:
100% automation coverage and 100% passed tests, on each and every release
This is the story of how we upped our game and were able to save valuable time in our weekly releases.
Of course we started with the obvious:
We wanted to reduce our automation maintenance, so we started to analyze our flaky tests, beginning with the bottom 15 percent:

Our flaky tests analysis in-house tool. (Resolution shown: last 30 days)
We went to the bottom of each test and cleared the most common flaky areas by:
- Removing static waiting time (yes, you use them for “debugging”)
- Refactoring flaky verification points
- Refactoring and cleaning our code to use better design patterns
- Separating data dependency in our tests
In addition, we increased our collaboration with our colleagues (Dev, DevOps and more), and gained more insight into our test design in the process, such as:
- Product and functional flows
- Architecture
- Our staging (testing environment vs production environment)
Our task was complete, or so we naively thought…
A week after our first stabilization cycle we experienced an unexpected decrease in stability. We went back to the drawing board as we had sporadic failures which didn’t make sense, and we needed to understand the root of these.
At this point, I need to go off-track and explain the complexity we’re dealing with.
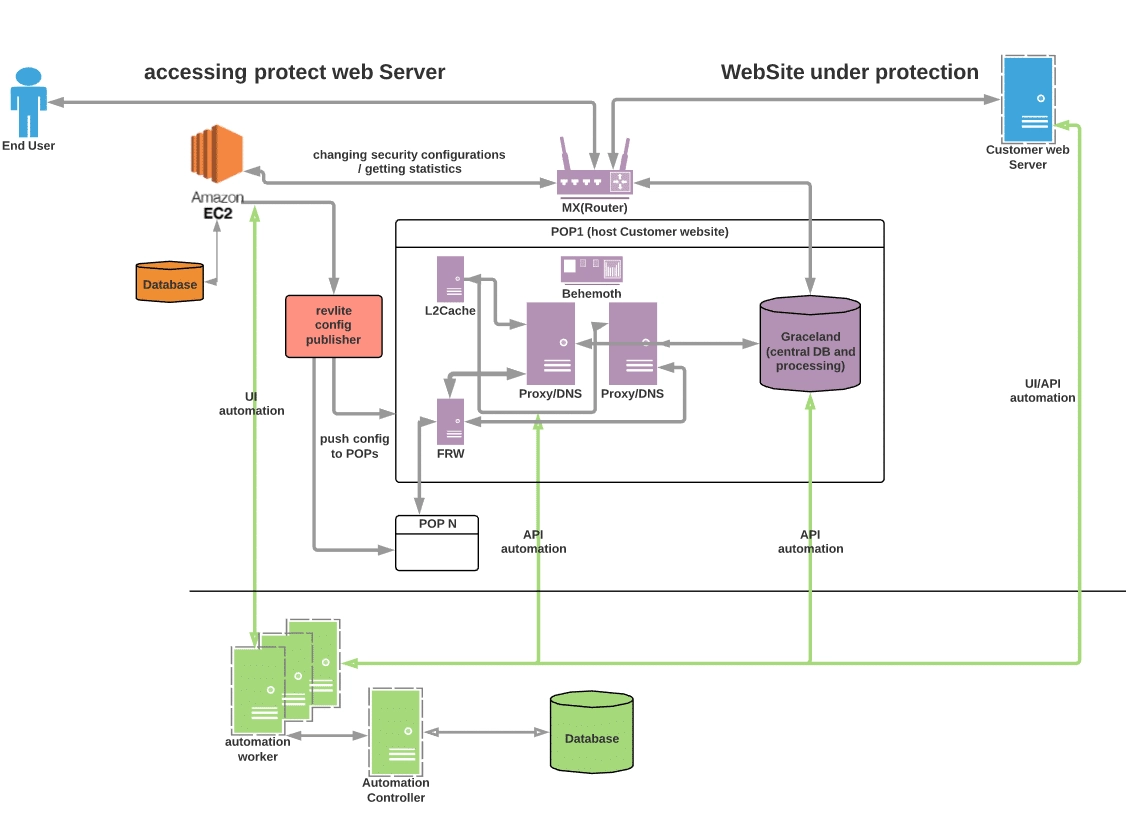
Our product is a Security SaaS solution consisting of tens of POPs (points of presence). Hundreds of software components are integrated together to give a vast array of solutions, with each of them integrated every hour in our staging environment.
Our effort to maintain a 100% green state, appeared more like a building a “house of cards”.
This called for a deeper inspection, so please follow me to the drawing board:
Our staging environment serves countless teams for pre-production integration
- Backend, engine & UI Dev teams
- Security teams
- DevOps team, NetOps team & IT
- Automation teams
Each member can break the environment as a whole or a tiny piece of it. But many of these changes were crashing our automation pipeline, leading to frustration and time loss.
We needed to up our game and add more protection layers before they became caught in automation regression.
Building our castle in three steps
1. Monitoring and alerts
We needed to find a way to “see” with higher clarity
Major components in our stage environment were lacking any monitoring (as shown in the diagram above), including:
- Part of our proxies
- Our automation components
Many components were monitored by our in-house grafana and our servers were monitored by NewRelic APM.
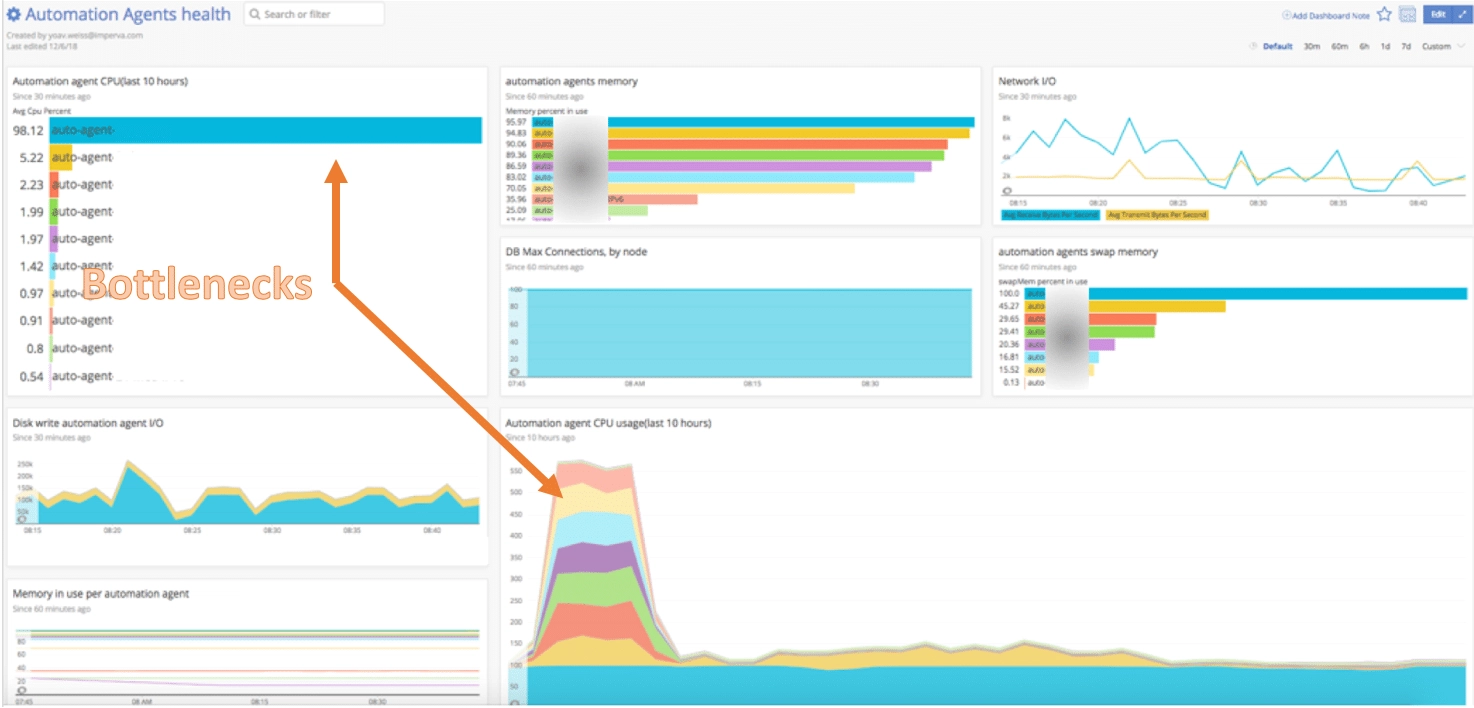
We chose to add infrastructure-level monitoring to all automation components, comprising more than 15 machines.
Our monitoring highlighted existing issues with our automation infrastructure, such as:
- CPU and memory hogs
- Low HD space
- Performance bottlenecks on our automation components
We learned that our automation health was another critical component on our path to being green.
We’d jumped our first hurdle.
2. Slim and quick Smoke test
Now that we knew where our pitfalls were, we needed a faster way of detecting them. When we had product-critical issues we wanted to know about them as fast as possible.
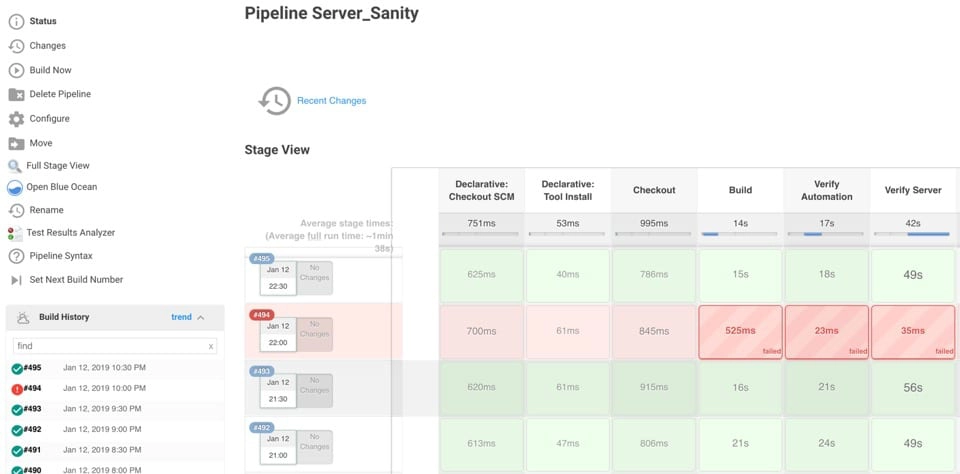
Our nightly pipeline,based on zookeeper, is complex, so we decided to build a Jenkins pipeline that would execute a 5-10 main-path test every 30 minutes.
It consists of two defence layers:
- Applicative health tests (log errors, connectivity, service checkups)
- Short main-path functional flows
Our concurrency for nightly regression is implemented via zookeeper, We wanted our Smoke test to be leaner, so we were required to implement concurrency by other means.
Our chosen technology stack comprised:
- TestNG concurrency
- Data providers
- Factory
- Jenkins pipeline to execute
A factory class:
SanityProxyLogsFactory
Calls:
SanityProxyLogs
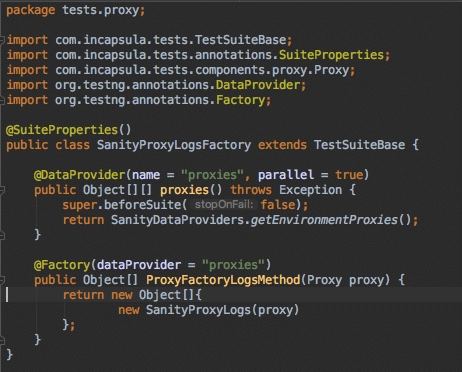
TestNG with Factory and DataProvider concurrency

Declaring the needed ThreadPool in an atomic class
Each failure will create a detailed mail / Slack message (we have several dedicated channels) to:
- The committer who caused the failure
- The component owning team
- This week stage “on call”
We created a Smoke test for each component, allowing us to zoom in to the failure in seconds.
This way, we crossed our second hurdle.
3. NetControl, our in-house health system
After enhancing the internal collaboration, it was time to further enhance awareness.
Asking questions led us to our in-house health monitoring system, NetContol.
There was one tiny problem, however – nobody had deployed it on stage (ever). So, after asking some more questions asking and a few failed attempts…
All relevant experts sat together one day and, through collaboration, we managed to figure it out!
Our last line of defense had been created – applicative health monitoring that executed every few minutes and raised alerts by mail and/or Slack any on issues that required attention
My midpoint conclusion
Our work hasn’t concluded (and likely never will be), the ideas and improvements from the team are ongoing. Though we all learned an important lesson, and it drove a paradigm shift:
Our automation is a product -> it should be treated as a product.
On this path, we learned how we can gain from cooperation with other teams. Our work completed, victory was ours – if only for a fleeting moment.
But this is only one milestone in our quest. Plenty of work remains , and many more challenges lie ahead before we can shorten our release cycle. But the shot of adrenalin is the fuel that drives our inspiration.
We’d love to know what you would have done differently or if you’ve faced similar challenges and if so, how you addressed or overcome them.
Try Imperva for Free
Protect your business for 30 days on Imperva.
