These days, our focus is on spoiling our customers. For example, we give our DDoS Protection customers the peace of mind that their network traffic is routing through Imperva’s cloud for consistent volumetric attack protection. That protection works pretty well, but customers have started asking us to supply them with detailed traffic patterns and in-depth statistics on that malicious traffic. And, while we’re at it, they’d also like us to supply the same for the legitimate traffic…
Well, the customer is always right. So we rolled up our sleeves and started designing a system that will deliver that information.
Imperva’s DDoS protection service consists of in-house developed scrubbing devices, with which each of our PoPs are equipped. One would assume that the difference between building a mitigation system and building an analysis system, both of which are fed with network traffic, would be quite small.
But it turns out the difference is huge. The design of a network appliance changes dramatically depending on its purpose.
In this article, I’d like to share the dilemmas and decisions we faced in designing our network analytics system. I’ll start with a high-level view – the components within our PoP – before proceeding to the application flow, and ending with a deep dive into the real-time calculation objects structure.
(This article will focus on the data-plane component. The entire system consists of several additional components, such as big-data systems, management console, etc.)
Brand New Component: Network Monitoring Device
We had two possible options for where we could perform the network traffic analysis – either within our existing scrubbing devices, the Behemoth, or on a completely new component.
Implementing the analysis within the Behemoth seemed to be the easier and faster way – it’s an existing piece of code, which already knows how to pull traffic, parse it, match it to a specific customer, analyze it, and report it to our big data systems. Moreover, this was how we collected the data which was shown on our previous, basic dashboards. However, it suffered from a few problems, which were the result of basing the data on sampled-and-mirrored traffic:
- Accuracy – as explained in the Behemoth blog, during peacetime the traffic is not diverted into the Behemoth app, but sampled. This generates inaccurate results.
- Correctness – not only is the traffic sampled, but it is also mirrored. This may generate incorrect results since (in rare cases) the mitigation decision for the mirrored packet and the real packet may be different.
But above all, we quite quickly reached the conclusion that performing so many complicated calculations on the traffic would result in significant performance degradation in the Behemoth, ending with latency, traffic drops, and a decrease in our time-to-mitigation.
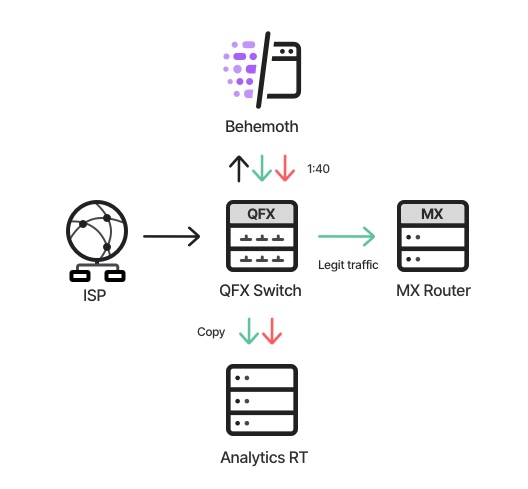
So, our decision was to develop a dedicated component which would be responsible for the data analysis – AnalyticsRT. AnalyticsRT would receive a copy of the traffic after it was scrubbed by the Behemoth, then analyze it, and drop it afterwards:
- As before, all ingress traffic enters the Behemoth
- The legit traffic, which comes out of the Behemoth, is copied and sent to AnalyticsRT
- The malicious traffic is dropped within the Behemoth; however, it is sampled (1:40), tagged as malicious, and forwarded into AnalyticsRT
This solved the three problems mentioned above – AnalyticsRT analyzes every legit packet, which supplies accurate results; the actual blocked traffic is tagged, which supplies correct results; and, since AnalyticsRT receives copies of the traffic, it is not actually part of the customer’s traffic data plane – so there couldn’t be a performance issue, such as any latency, traffic being dropped, etc. This also gave us the advantage of scalability – we can add as many calculations as we want, as long as AnalyticsRT can handle it.
The decision of having a dedicated component gave us the luxury of designing it for its specific purpose:
Run-to-completion vs pipeline
Run-to-completion is a design concept which aims to finish the processing of an element as soon as possible, avoiding infrastructure-related interferences such as passing data over queues, obtaining and releasing locks, etc.
As a data-plane component, sensitive to latency, the Behemoth’s (and some supplementary components) design relies on that concept. This means that, once a packet is diverted into the app, its whole processing is done in a single thread (worker), on a dedicated CPU core. Each worker is responsible for the entire mitigation flow – pulling the traffic from a NIC, matching it to a policy, analyzing it, enforcing the policy on it, and, assuming it’s a legit packet, returning it back to the very same NIC.
This design results in great performance and negligible latency, but has the obvious disadvantage of a somewhat messy architecture, since each worker is responsible for multiple tasks.
Once we’d decided that AnalyticsRT would not be an integral “station” in the traffic data-plane, we gained the luxury of using a pipeline model, in which the real-time objects “travel” between different threads (in parallel), each one responsible for different tasks. We still had to verify that the throughput of the system met our requirements, but latency was no longer an issue.
The pipeline flow is:
- Dispatcher – responsible for pulling packets from the NIC, matching each packet to a corresponding RT object, and forwarding the RT object and the packet quintessence to the next thread
- Spreader – spreads the dispatcher’s messages across all workers
- Worker(s) – each worker processes the packets into the RT object (see below)
- Reporter – converts each RT object into a deliverable message
- ReporterIO – sends the prepared message over Kafka towards our big-data system
Now let’s take a closer look at those RT objects:
Network Modularity, Load Balancing, and lockless programming
AnalyticsRT was designed as a framework for real-time traffic analysis. As such, it should support future calculation algorithms which aren’t currently implemented.
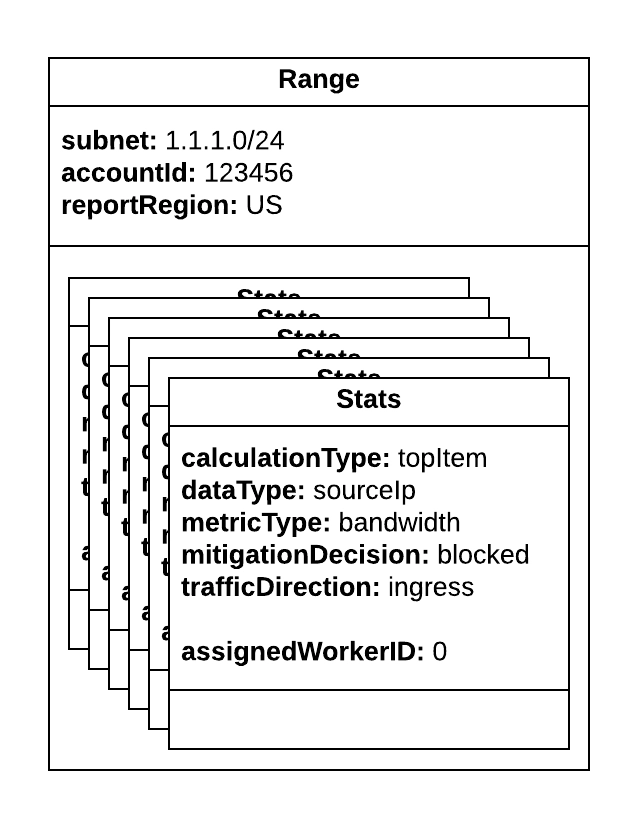
As mentioned before, the dispatcher builds a real-time object – “range” – for each customer subnet. That object encapsulates multiple statistics objects – “stats” – which were built during the range construction, according to predefined configuration. The worker’s job is to process a given packet into the stats objects.
Each statistics object represents the combination of several metrics. The main ones are:
- Calculation type (math algorithm, such as sum, histogram, top K frequent elements, hyper loglog, etc.)
- Data type (source IP, destination port, VLAN, etc.)
- Metric type (PPS, bandwidth, # of TCP connections, etc.)
- Mitigation decision (passed\blocked)
- Traffic direction (ingress\egress)
Assuming someone wants to add a new statistic, such as adding the calculation of most frequent VLANs, for example, there’s a good chance that it will only require a configuration change, without any code modifications. The only case in which a code change is required is when someone wants a new calculation algorithm which is not yet supported. In such a case, it will be necessary to implement a class which performs the required algorithm.
Since we wanted to maximize the system’s capacity, the workers’ design is based on two concepts:
- Lockless programming – avoid locks in the workers, since obtaining and releasing them wastes CPU cycles
- Load balancing – equally spread the workload across all workers, since the first choked worker defines the entire system throughput
Assigning each stats object with an affinity to a specific worker solved the locks issue. But which worker would it be?
- The most naive approach was to assign an entire range object, alongside all its encapsulated stats objects, to a specific worker – range X will be handled by worker 0, range Y will be handled by worker 1, and so on. One would assume that, since we have tens of thousands of range objects and only 10-20 workers, the load would be balanced. However, since a given customer subnet, represented by a range object, might receive a volumetric DDoS attack, this isn’t a valid option. Processing all of the stats objects within an attacked range on a single worker will choke that worker immediately. In such cases, traffic towards other ranges assigned to the same worker will not be processed.
- Our second option was to assign each stats type to a specific worker, regardless of which range object encapsulates it. But, since different stats types consume different amounts of CPU resources, the load will not be balanced by design.
- So, we chose to assign a given stats object to a specific worker, regardless of its type and\or its encapsulating range object – a pseudo-random type of approach. Since we’re dealing with large numbers – tens of thousands of range objects, each one encapsulating dozens of stats objects – this guarantees optimal load balancing.
This table demonstrates the three possible options for assigning workers:
…and they lived happily ever after
Over the past two years, we’ve started using the network analytics system for additional needs beyond those originally planned. As mentioned, the original motivation was to enrich our offline dashboard – today it also serves our SD-NOC system, which automatically handles pipe congestion in real time, and our SD-SOC system, which automatically adjusts our customers’ security policies. Moreover, it also analyzes NetFlow traffic and triggers our events system.
This has been achieved without any design changes and with relatively small code additions. This is as a result of the initial design, which keeps the analysis out of the traffic data-plane, can easily scale up, and enables adding more actions and calculations without interfering with the existing ones.
Try Imperva for Free
Protect your business for 30 days on Imperva.


