Understanding an attacker’s workflow and how Attack Analytics hunts them down
In recent years we’ve seen a significant increase in the number and complexity of cyber-attacks. The accessibility of public tools and their automation capabilities, as well as distributed and anonymization features that enable attackers to work under the radar, create quite a challenge for organizations in protecting their main business. Many report alert fatigue – the exhaustion of sifting through a large number of false-positive and non-valuable information. Imperva’s survey shows that more than a quarter of IT professionals receive at least a million alerts a day, while many more (55%) report over 10,000. Traditional defense systems of the past use tools and methods that have failed to face this evolving challenge – unable to handle the majority of alerts, SOC teams can simply crash under the daily overload (Figure 1).
In this article, we’ll try to get into the mind of attackers and their workflow, explain why traditional defense methodologies fail time after time and present why Attack Analytics – an innovative approach based on machine learning algorithms – can offer real value and insights for those tasked with hunting down the attackers.
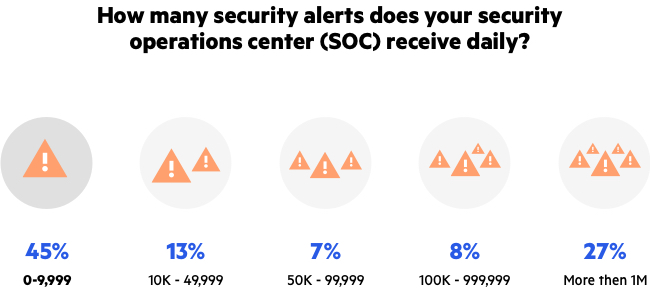
Figure 1: Alert Fatigue (IT Professionals Survey, Imperva)
Step by step for getting inside your website
In a previous blog, we talked about the Data Breach Kill Chain and the importance of early detection during the reconnaissance stage. Now, we’ll explore how an attacker’s workflow comes to life and what insights can be generated from the website owner’s perspective.
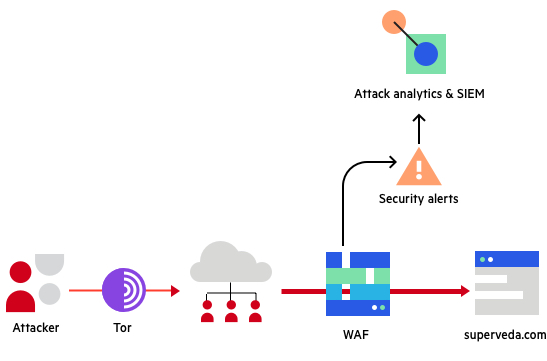
Figure 2: Experiment architecture
Let’s put ourselves in the position of an attacker. Our target is a standard shopping website for books and video games, as shown in figure 3. The site is protected by a centric web application firewall (WAF) that generates alerts for any intrusion attempt.

Figure 3: SuperVeda online shopping site
Preparations
We need to maintain our anonymity so therefore choose to work via TOR. And in order to support all traffic routing through TOR, we also install AdvOR (Advanced Onion Router) and change the machine’s local proxy setting to route all traffic through port 9050.
And that’s it – we’re good to go!
Reconnaissance
As the attacker, our goal is to gain as much information as we can about the website, its structure and any available sensitive data that can be accessed. To help us in this, we use the free tool ZAP by OWSAP to perform an automated passive scan.
But, just how noisy were we? Remember that our origin source is anonymous and changes every few minutes. Even so, we still don’t want to have any suspicious peaks in network traffic during the scan, so we can just change the delay parameter between messages. Of course, we’d like this value to be as large as possible. Figure 4 shows the network activity (request per second) from the site’s perspective.

Figure 4: Network activity (RPS) during ZAP automated scan
During the three hours of the scan (this can be even longer), as the attacker we triggered 1,782 alerts on the WAF from seven countries and 20 unique IPs. Despite this, though, we now have a full view of the website structure and have uncovered some recommendations on vulnerabilities that were found.
Exploitation
We now focus our attack on three main URLs identified in the scan: /proddetails.jsp, /addcomment.jsp, /showproducts.jsp and use SQL map as our main attack tool. This gives us some options to add a layer of obscurity between us and the website, and we use TOR flags to add anonymous proxy support. If we wanted to, we could also change the referrer, define a random user-agent and/or play with the timing parameters.

After running for a few seconds, we find a parameter that appears to be vulnerable (Figure 5).

Figure 5: A vulnerable parameter found by SQL map
Data access
Now that we’ve found our way in, we can try to access the data. Our next step is to find out the database names by using the –dbs flag and the tables’ names with –tables flag. Once we have a list, it’s a good idea to look at the columns of some of the most important tables like USERS, ADMINUSERS or VOUCHER.
Now comes the most fun part – dumping the tables using the –dump flag. Some results are shown below:

Figure 6: USERS table dump using SQL map
Our use of SQL map resulted in 274 events on the WAF from multiple countries as shown in Figure 7.

Figure 7: SQL map attack from distributed origins
With so many alerts, how could our target possibly know what had happened on their website? How could they know the nature of the attacks? Like most people, they’ll probably attempt to answer these questions by using a SIEM solution. Unfortunately, this isn’t likely to tell them the whole story…
Why traditional SIEMs fail
Security Information and Event Management (SIEM) is a software solution that provides real-time aggregation and analysis of security alerts generated by applications. A SIEM system allows you to receive security alerts in one central location using one or more dashboards based on predefined rules and correlations.
In using a SIEM, however, you may discover that, although your security teams are hard at work, they’re often still struggling to gain valuable insights. Here are some key SIEM challenges we’ve identified over time:
SIEM is a hollow head, you put the brain in
The basic misconception about SIEM is that it collects millions of logs per day and thus effectively manages to identify attacks and provides meaningful insights out-of-the-box. In reality, though, a SIEM comes with a baseline set of rules that aren’t customized to your organization and the particular problem you face. The security team therefore needs to configure it – a process that can often be quite frustrating.
SIEM is like a bike, it needs constant pedaling
The initial configuration is not the end of the story. The security team will need to continually define rules, correlations and use cases following changes in the data and its sources. Meaning, the SIEM is a dynamic environment, constantly changing along with the changes in the data.
SIEM requires SIEM experts
SIEM is a complex system that requires an expert to operate. However, almost half of the organizations (44%) that responded to a 451 research survey, reported a lack of expert manpower.
SIEM generates a large number of alerts, most of them irrelevant
The task of locating data and insights in a SIEM can be quite challenging. Since SIEMs are aggregate-based, they’re predefined with regards to how the data is aggregated. But what if you aggregate your alerts by IP or subnet but the attack comes from a distributed origin? What if you look for alerts on the same URL but the attacker performs a URL scan? What if you just focus on paths with common patterns?
In reality, every attack looks different – it’s difficult to define a set of rules that will hunt for every single one of them. Data aggregation is focused on some dimensions of the attack but will ignore others. Deciding how to bring those alerts together is crucial, as legitimate and illegitimate data can be put together, along with alerts from different attacks.
SIEM often fails to provide context around the alerts and priority
Most SIEMs often prefer data collection over log enrichment. Therefore, they often tend to lack context, which can be critical when investigating an attack. Do we deal with a known malicious IP? Have similar attacks been spotted before in other organizations like ours? To know this, you’d need to use other tools to complete your knowledge.
SIEM gave me an alert, now what?
We received a warning and have just finished investigating it. Now we need to take the necessary steps to prevent such cases occurring in the future. But what exactly should we do? Do we block a specific IP? Or maybe the whole subnet? Should we increase the security for more targeted assets? The role of a standard SIEM is complete once it’s supplied the alert – it’s now up to the security team to decide what to do next and when.
Our use case
The use case above described our three main phases of attack. At each phase mentioned in the table below, we’ll try to look for common dimensions of the attack that could help us to aggregate those alerts together with the final conclusion resulting in a fail when choosing to group any of the alerts together.
The rows in the table below show the different phases of the attack and the columns highlight the different dimensions (origin, target, etc.). A red cell indicates diversity in a particular dimension that prevents aggregation while a green cell indicates common characteristics.
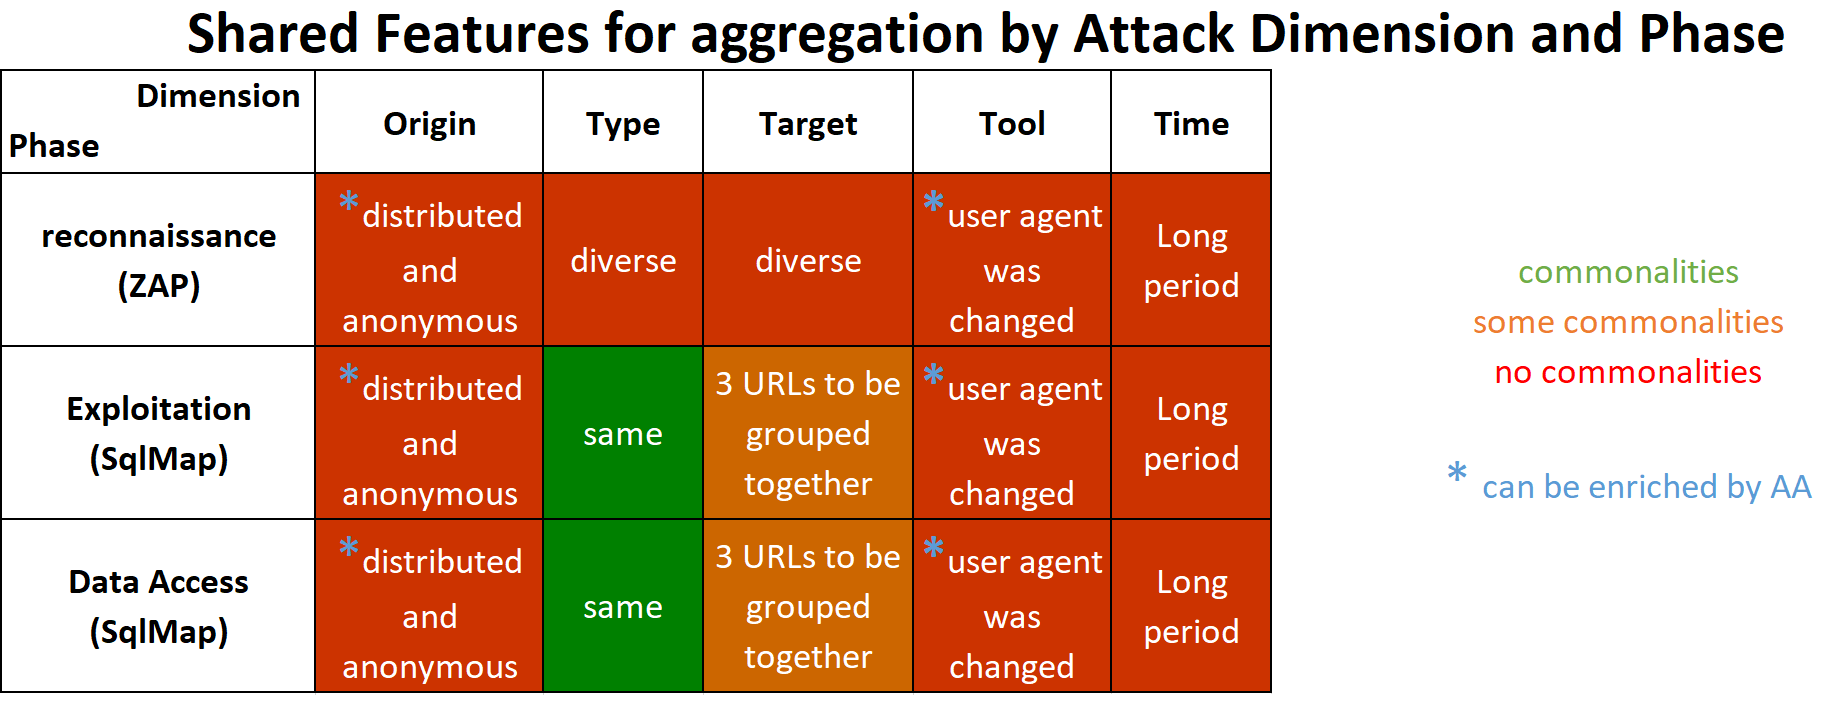
You’ll see that no phases have a common origin as the IP was changed every few minutes. Likewise, as we kept a low profile throughout the attack in terms of the number of requests per second, the time dimension isn’t useful either. Looking at the tool dimension could be challenged too, as the user agent was changed in each phase. While advanced security systems, like Imperva’s WAF, can track the true client application of the attacker, a simple SIEM without any enrichment and context will face some major issues here.
For example, we can see that, in the first phase we have no way of unifying the alerts using only aggregation. In the next two phases, grouping by the target dimension will bring them together but will generate three separate incidents – one per URL (with the chance of infection by other irrelevant attacks on those URLs).
Multi-dimensional view for clustering attacks
Plug & play approach
Imperva’s Attack Analytics works with the plug & play approach and no settings nor updates are required. The insight this offers into the attacks is simple, readable and can be used by the SOC teams as well as by high-level strata in the company.
Keep it simple, keep it short
Attack Analytics consolidates thousands of security alerts to produce a few genuinely useful insights into security events in your organization. Every incident will summarize the main characteristics of the attack in a short sentence.
Events that matter
Using a machine learning method of clustering, Attack Analytics defines a distance function between security alerts looking at all the dimensions of attacks – source, target, tool, type, time and more. Working with this dynamic approach enables it to capture different types of attacks.
Figure 8 shows some real attacks that were detected by Attack Analytics last year. As we can see, every incident was grouped by different aspects of the attacks (in green). The streaming clustering algorithm looks for the distance between alerts, so that if they’re close enough in some dimensions they’ll be assigned to the same cluster.
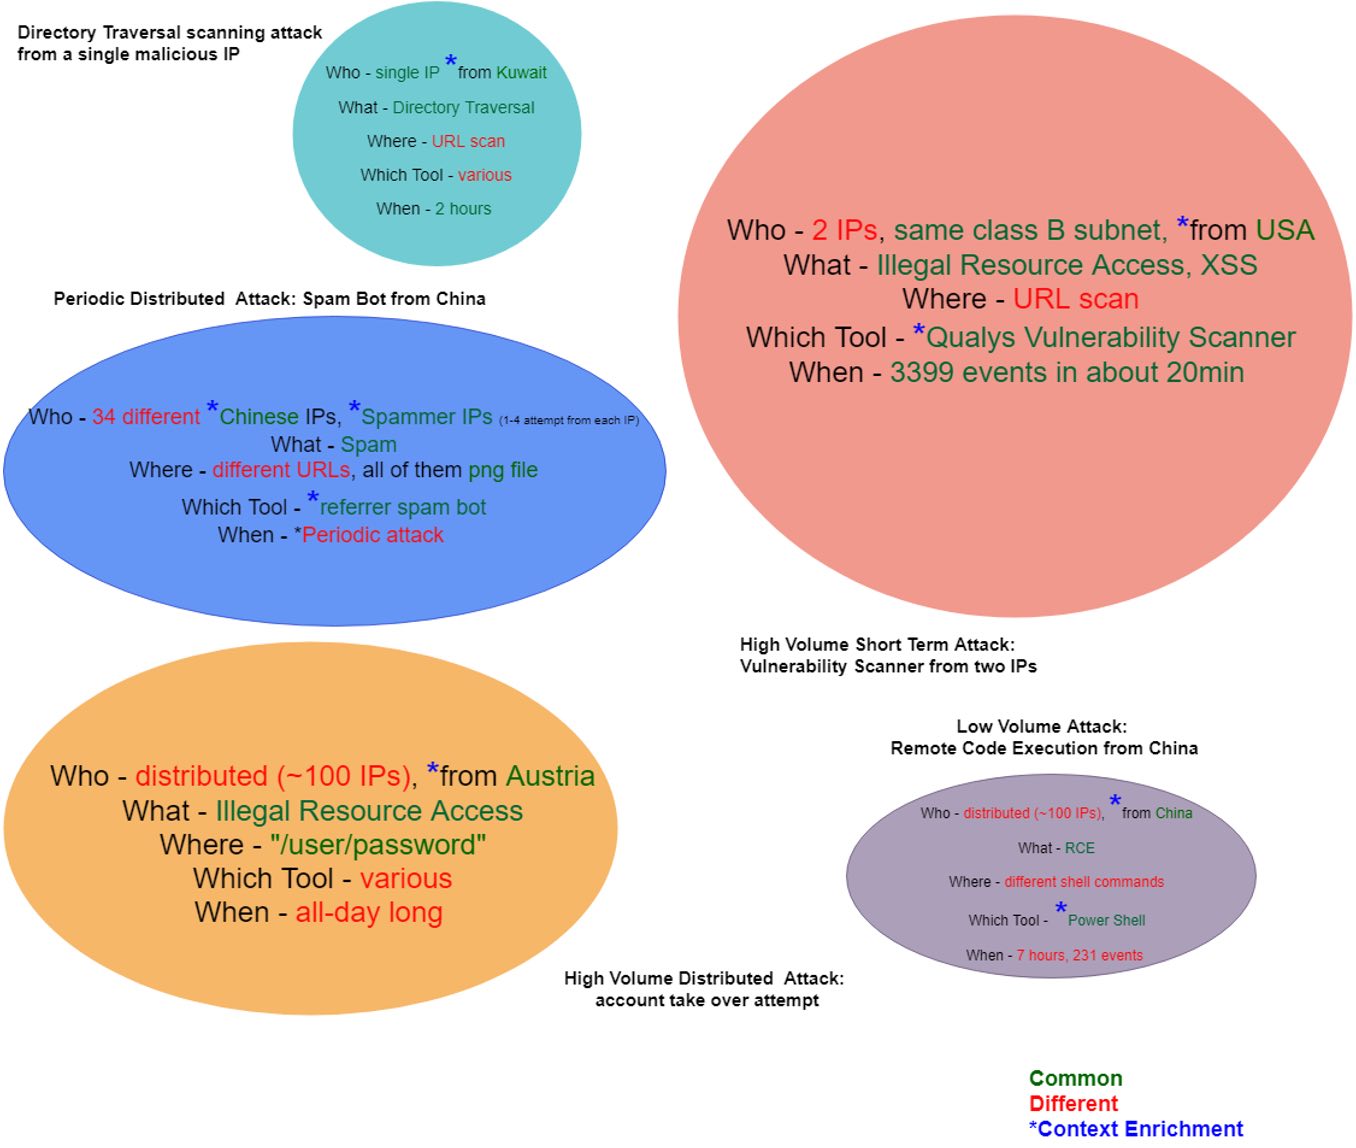
Figure 8: incident examples by Attack Analytics
View the context
Sometimes the alert is not enough and we need to enrich it with proper context. Figure 8 shows some examples of that type of context – the subdivision or country of the attacker, the IP reputations (was it previously identified as malicious, hiding behind a proxy, or just a spammer source?) and even the real client application (changing the user agent is just too easy). Lastly, another type of context provided by Attack Analytics is an indication of similar attacks on other sites.
What to do next
Of course, knowing what happened is just the beginning. We’re now required to respond accordingly in order to prevent such incidents in the future. A new upcoming feature of Attack Analytics will offer users recommendations for ways of increasing site security based on system incidents.
Caught in Attack Analytics’ net
Back to our attack on the standard shopping website mentioned earlier – let’s take a look at what Attack Analytics managed to catch. You’ll remember that the attack was distributed and anonymized by TOR, while using a long delay between every message.
We carried out a passive scan of the site before focusing a SQL injection attempt on three main URLs. Figure 9 shows that Attack Analytics was able to capture these attacks.
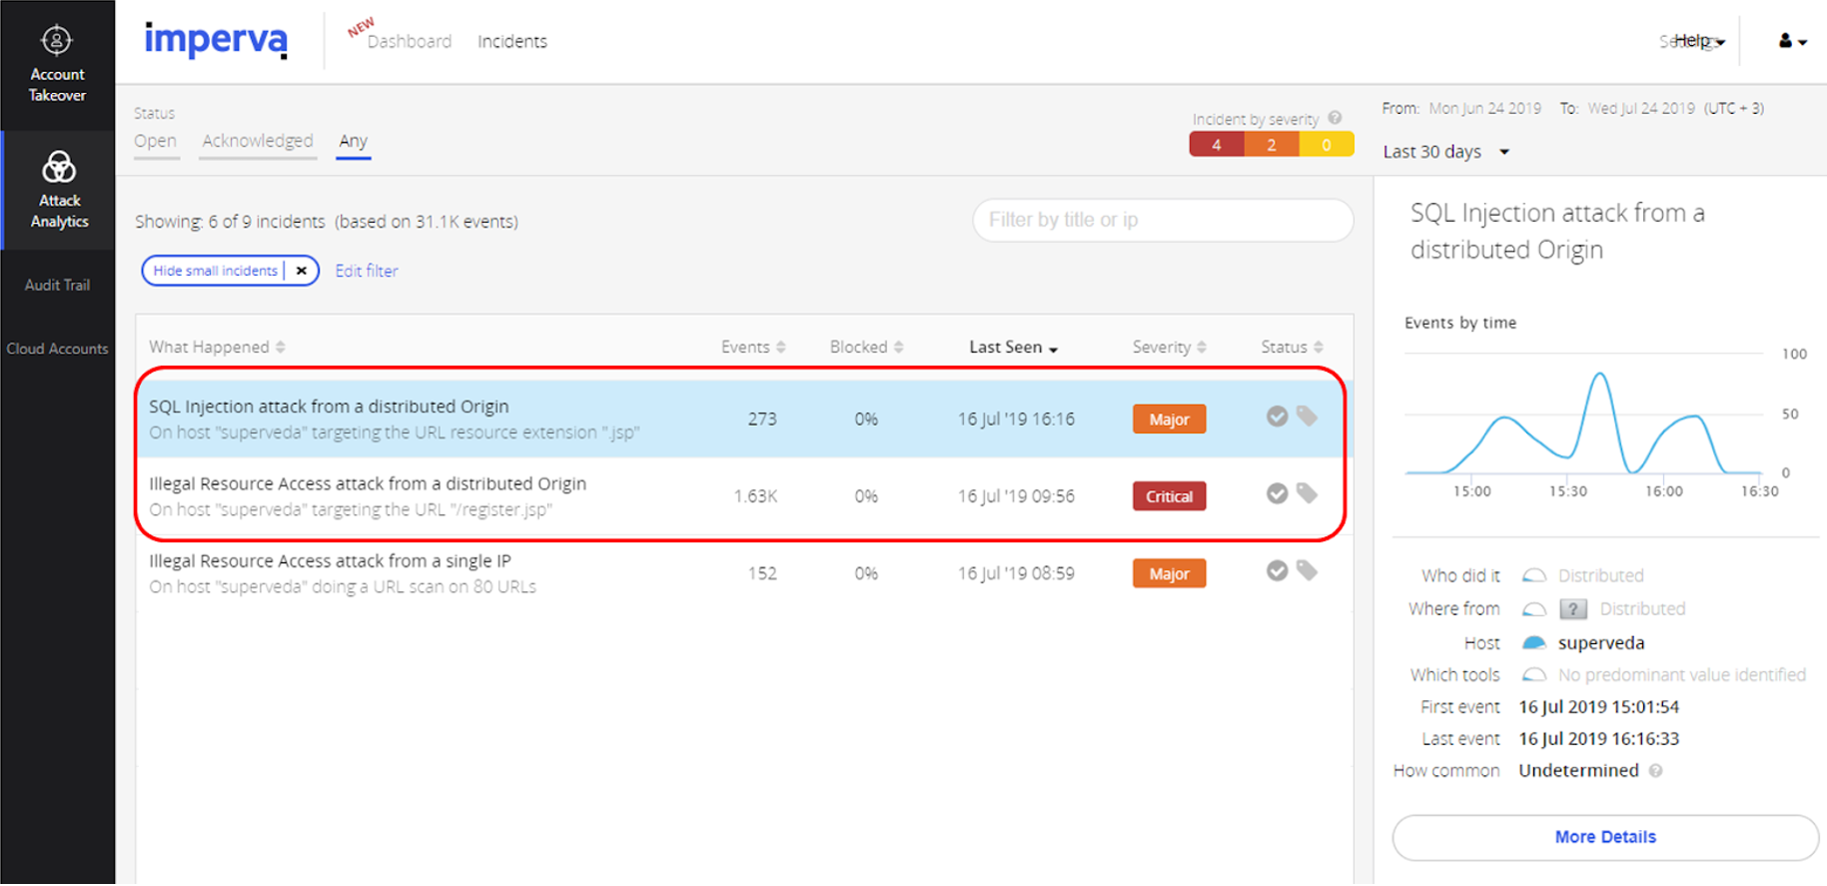
Figure 9: Attack Analytics view
For the scan phase, the system was able to bring together alerts from a different source and identify them as Tor-IPs (Figure 10).
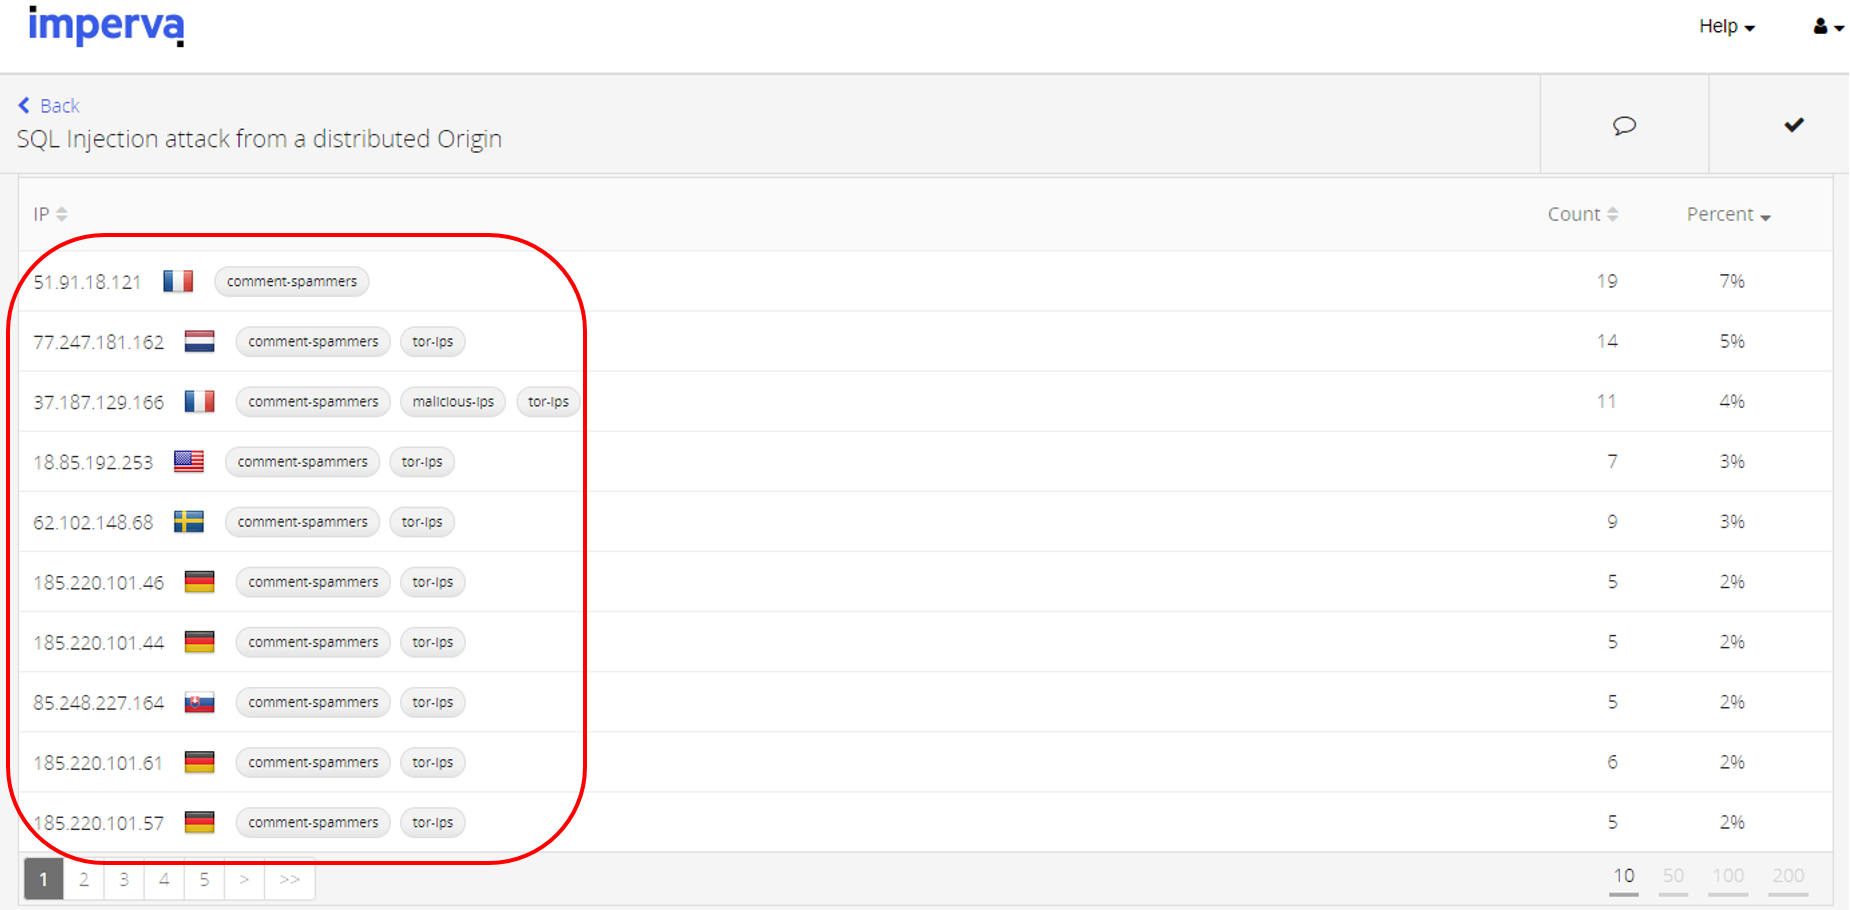
Figure 10: Passive scan from distributed Tor-based origin
In the second stage, the system successfully identified the attack type and the assets that were under attack (Figure 11).
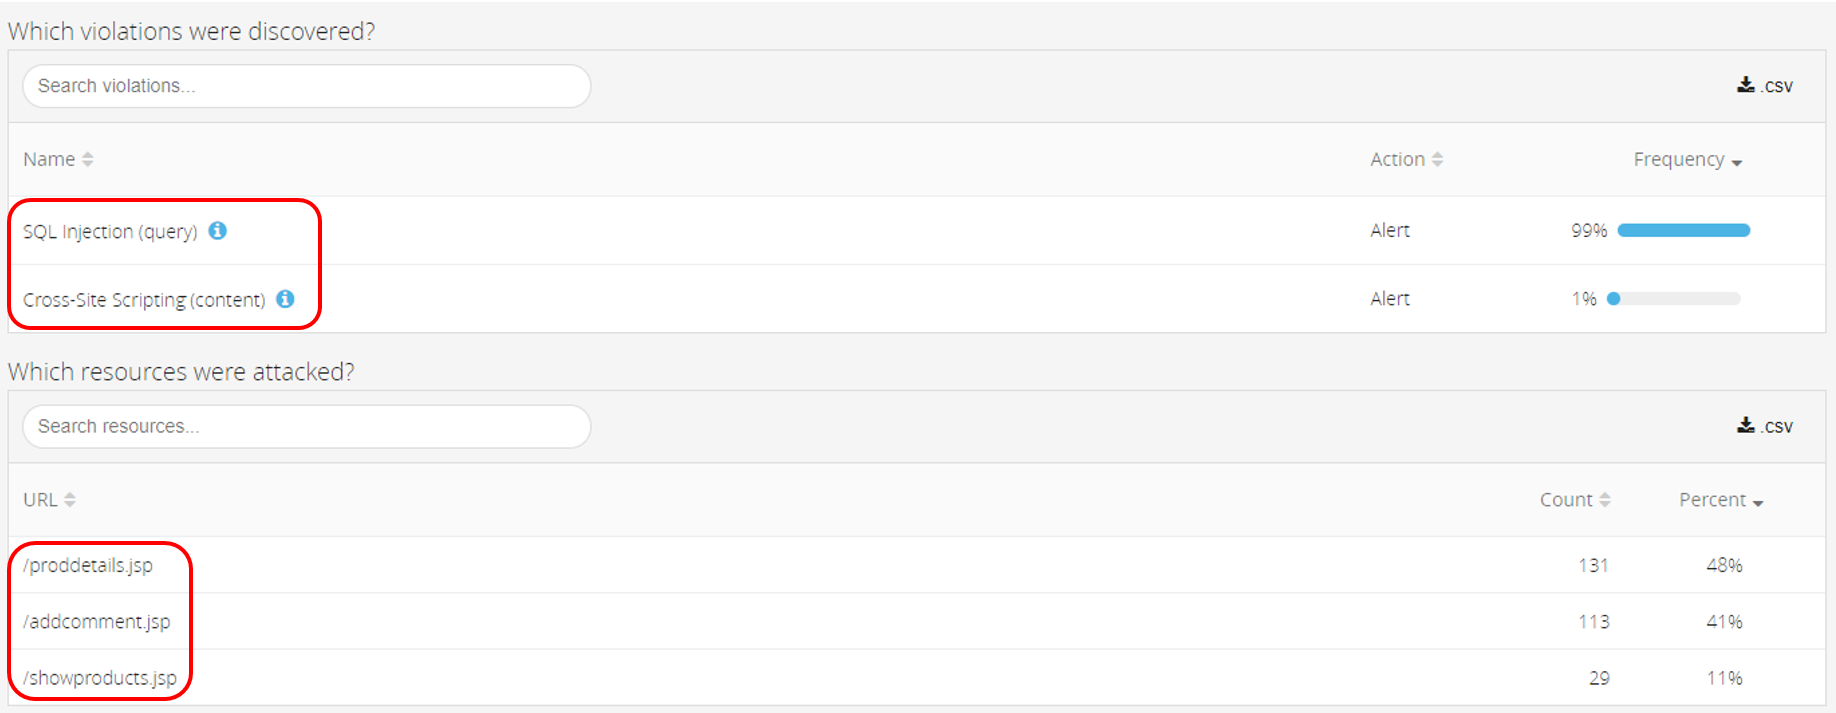
Figure 11: SQLi on 3 main targets
And in addition to data enrichment, each of the stages had enough different dimensions in common to enable the creation of the cluster. In this example, you’ll see that the user gets a clean short sentence summarizing exactly what was happening on their website, as well as further information about the attack properties.
Closer
In this article, we’ve seen that traditional SIEM-based methods simply fail to capture complex attacks. The main reason for this lies in the fact that it’s not possible to give a simple description of what an attack looks like. Systems based on pre-defined rules and aggregation methods will continue to fail the task of giving real insights.
Imperva’s Attack Analytics adopts a different approach – utilizing a machine learning clustering approach, and defining a distance function between security alerts that measures the difference in all dimensions of the attack. By turning thousands of alerts into a limited number of incidents, this method will tell you exactly what was attacked, who was behind the attack, and how they did it.
Try Imperva for Free
Protect your business for 30 days on Imperva.


