Every once in a while we’re required to analyze big data on a wide time range. Here’s a common example: “Can you analyze what happened during 2020? And don’t forget to compare it to 2019”.
Questions like this are hard to answer in the big data world:
- Queries may take a long time to process – and their cost is high, accordingly.
- An analysis normally shows different aspects of the data – which means we have to do the heavy queries again and again.
In this post we’ll explain what made big data analysis and reporting easy(ier) for us. Examples are based on data from the Imperva Threat Research Data Lake, which stores millions of objects and billions of records. We’ll use Presto as a SQL query engine and Apache Zeppelin as a data visualization tool.
Read more to learn about our simple template for analysis and reporting.
The data and the problem
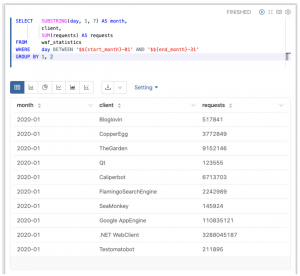
Imperva’s application solution, WAF (Web Application Firewall), collects data on traffic and attacks. Every day we see tens of billions of http requests and analyze them. For this example we’ll use our web client classification information, which maps a request to a web client (Like a browser or a hacking tool). Here’s a query example:

The parameters are shown as part of the notebook and are configurable. In our example we can run the dashboard on different time ranges without changing the queries:

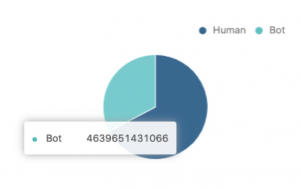
Here’s an example of a report chart – the distribution of human / bot traffic:

This may seem like an easy query – but it’s not. It takes a long time to process because of the wide time range. Having many items in the report will cause many heavy queries of which this is only one very simple example.
There are ways to improve performance, however, like, in our case, using a dedicated table which aggregates the data per type, or per month or per both.
If the data is used frequently, then this is the best way to do it.
But, if the set of data is used only for analysis or for the report, or you have no-one to create a new table for you, we’ll explain how you can get to the same results.
The solution – a temporary dataset
When we start an analysis or a report, we think about a dataset which will be used, and create a temporary table for that purpose:

The first two paragraphs are used to drop the old table if it exists, and then create the new data set. The next paragraphs will use that data set, with the option of using more tables from the database. We used Presto’s CREATE TABLE AS option, other databases support the same functionality.
Here is an SQL example for finding the top five human clients:

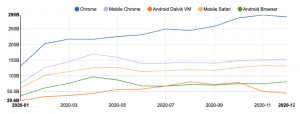
We didn’t need to use the original table, which made the query return in a few seconds instead of several minutes. We also didn’t need to perform the processing, like converting day name to month, grouping and filtering. All of that was already done for us while creating the external table. Here are the results:

You can use one or more temporary datasets in your report and control data retention in your database. We keep the data for one day, and if someone wants to use the report notebook again, – the temp table can be recreated by simply running queries creating it.
Takeaway
Using a temporary dataset as part of an analysis or a report development helped us to get better results in a shorter period of time:
- Queries performance improved.
- Reuse of data and and reuse of SQL-like filters or grouping improved consistency.
This is a simple method which can be carried out on various databases, with different visualization tools. You can try it on your own database by simply running a CREATE TABLE AS query.
Try Imperva for Free
Protect your business for 30 days on Imperva.


